Was Utah Fish Stocking Really Down in Early June? What the DWR Archive Shows for 2024–2026
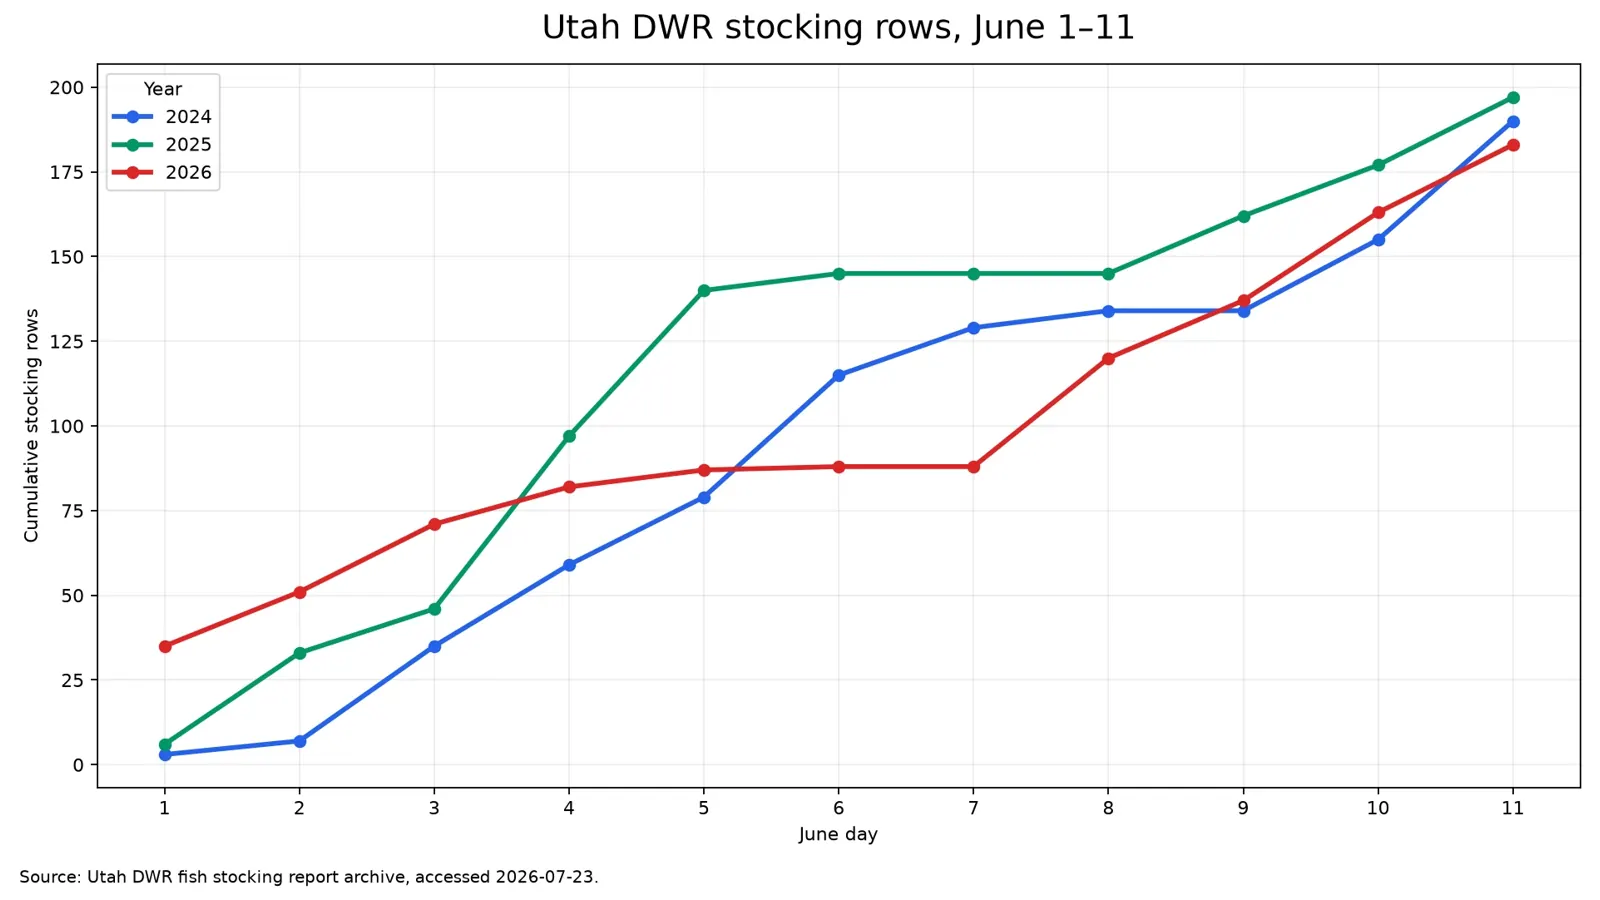
We pulled the Utah DWR stocking archive to test a popular early-June slowdown claim. The result: 2024 really did show 190 rows from June 1–11, but the current archive does not support the often-repeated “76 this June” number.
Was Utah Fish Stocking Really Down in Early June? What the DWR Archive Shows for 2024–2026
A Reddit post about Utah fish stocking made a sharp claim: 190 stocking rows from June 1–11, 2024 versus only 76 “this June.” That kind of drop would matter to anglers planning around fresh plants, especially if you fish community ponds, easy-access trout water, or repeat stops like Tibble Fork Reservoir.
So we checked the source directly.
Using the public Utah DWR fish stocking archive as it appeared on July 23, 2026, we compared the same early-June window across 2024, 2025, and 2026. We also broke the data two different ways:
- Rows: each line in the DWR table
- Water-date pairs: one waterbody on one date, which is often closer to how anglers think about a stocking “stop” or “trip”
Short answer
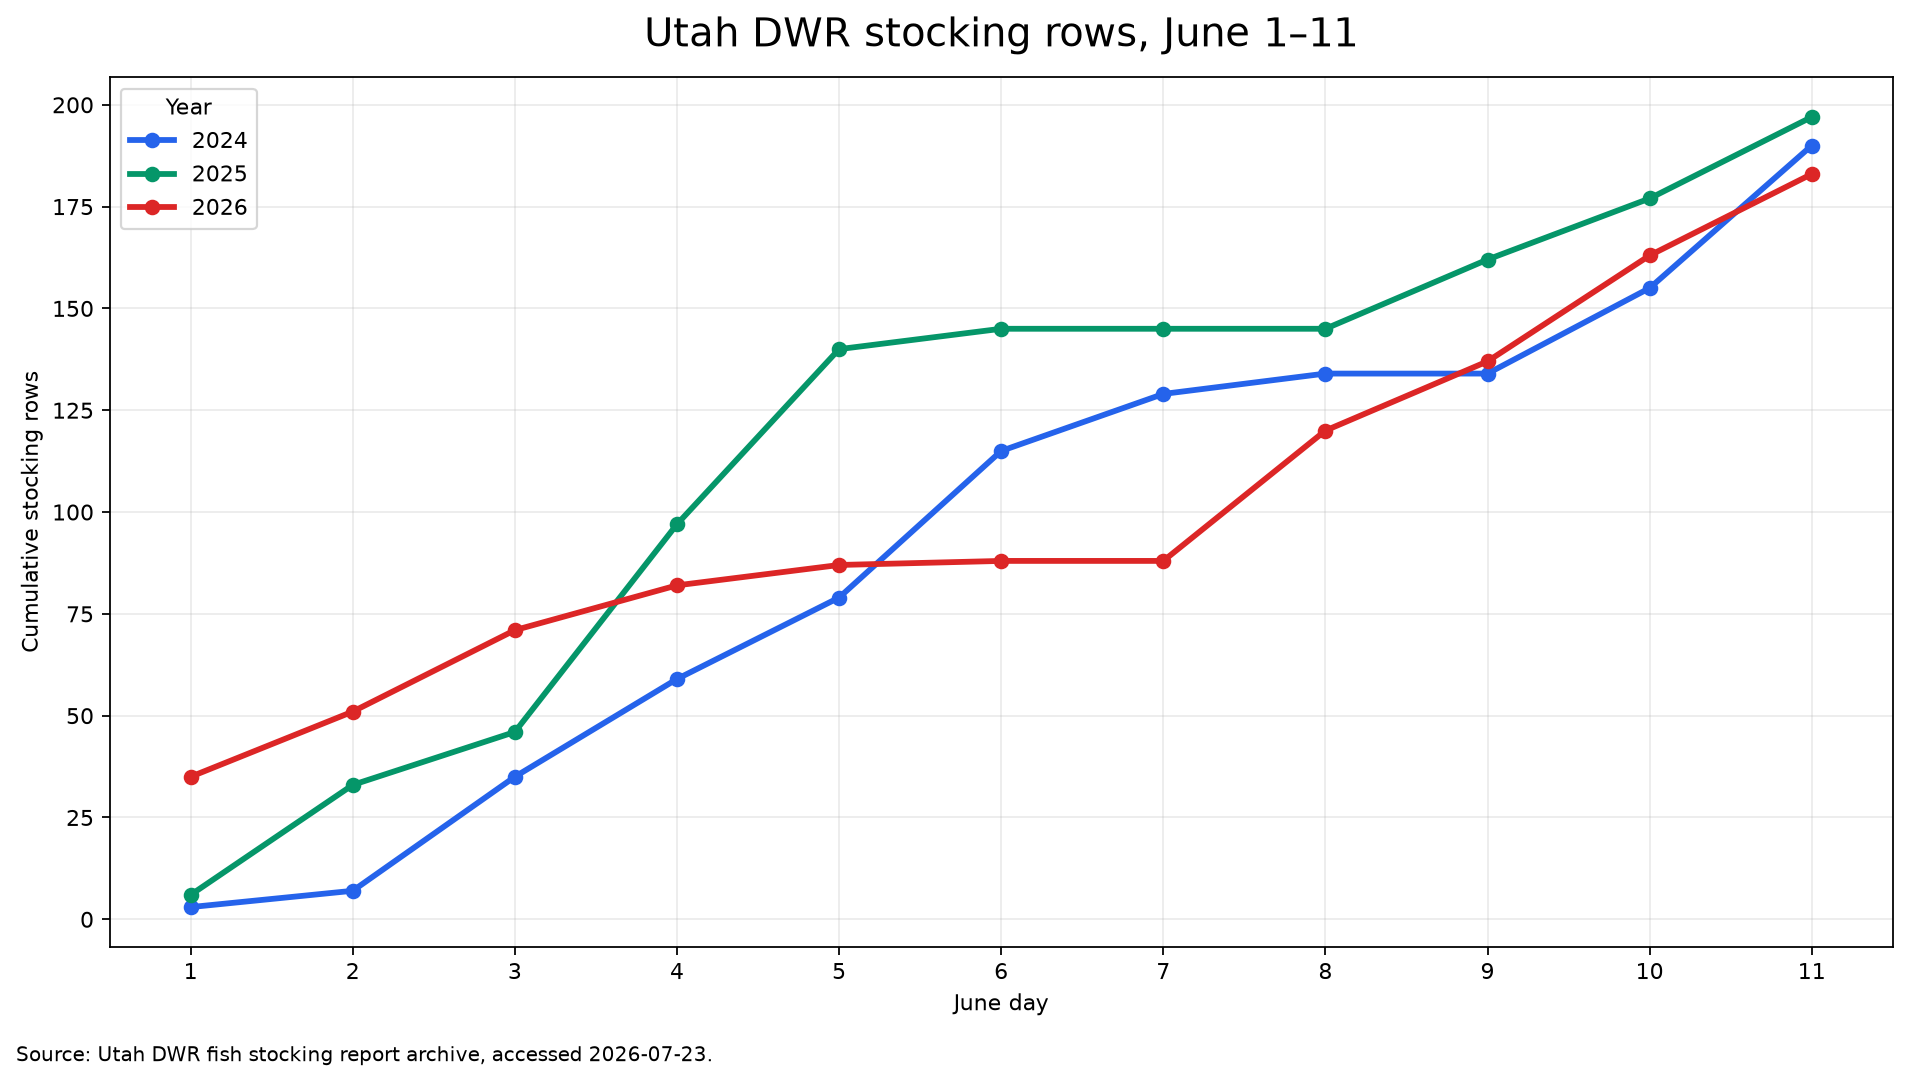
- The current archive does confirm 190 rows from June 1–11, 2024.
- The current archive does not confirm 76 rows for the same June 1–11, 2025 window. Today, that page shows 197 rows for that period.
- Early June 2026 came in at 183 rows, which is lower than 2025 on rows but still close to 2024.
- The more interesting shift is not just volume. It's the mix: early June 2026 shows far fewer channel catfish rows and many more tiger trout rows than the prior two years.
Early-June comparison: what changed?
| Year | June 1–11 rows | Water-date pairs | Fish in quantity column | Unique waters | Tibble Fork through June 11 | | --- | ---: | ---: | ---: | ---: | --- | | 2024 | 190 | 148 | 909,139 | 124 | 7 rows across 4 stocking dates | | 2025 | 197 | 132 | 783,503 | 112 | 4 rows across 4 stocking dates | | 2026 | 183 | 165 | 865,149 | 126 | 9 rows across 5 stocking dates |
That table points to a few real takeaways.
1) 2025 was not lower than 2024 on raw row count
If you use the DWR table exactly as archived now, 2025 was actually 3.7% higher than 2024 on rows in the June 1–11 window.
2) But 2025 did stock fewer total fish than 2024
The quantity column dropped from 909,139 fish in early June 2024 to 783,503 in early June 2025, a 13.8% decline. So a person scanning the archive could come away feeling like stocking had slowed down even though the row count was not lower.
3) 2026 looks different again
Early June 2026 logged 183 rows, down 7.1% versus 2025, but the quantity total bounced back to 865,149 fish. That means 2026 looked lighter on logged events than 2025, while still moving a large number of fish overall.
The species mix changed more than the headline count
Rows are only part of the story. Species distribution changed a lot.
Early June 2024 top species by row count
- Rainbow: 101
- Channel catfish: 30
- Tiger trout: 19
Early June 2025 top species by row count
- Rainbow: 123
- Channel catfish: 31
- Tiger trout: 16
Early June 2026 top species by row count
- Rainbow: 117
- Tiger trout: 37
- Channel catfish: 11
The biggest swing is easy to spot:
- Channel catfish rows fell from 31 in 2025 to 11 in 2026, a 64.5% drop.
- Tiger trout rows jumped from 16 in 2025 to 37 in 2026, a 131.2% increase.
If your mental model of “June stocking” is mostly tied to urban catfish ponds, 2026 would feel slower. If you're watching trout-heavy destinations, the picture looks different.
Monthly pattern: June is important, but it isn't the whole schedule
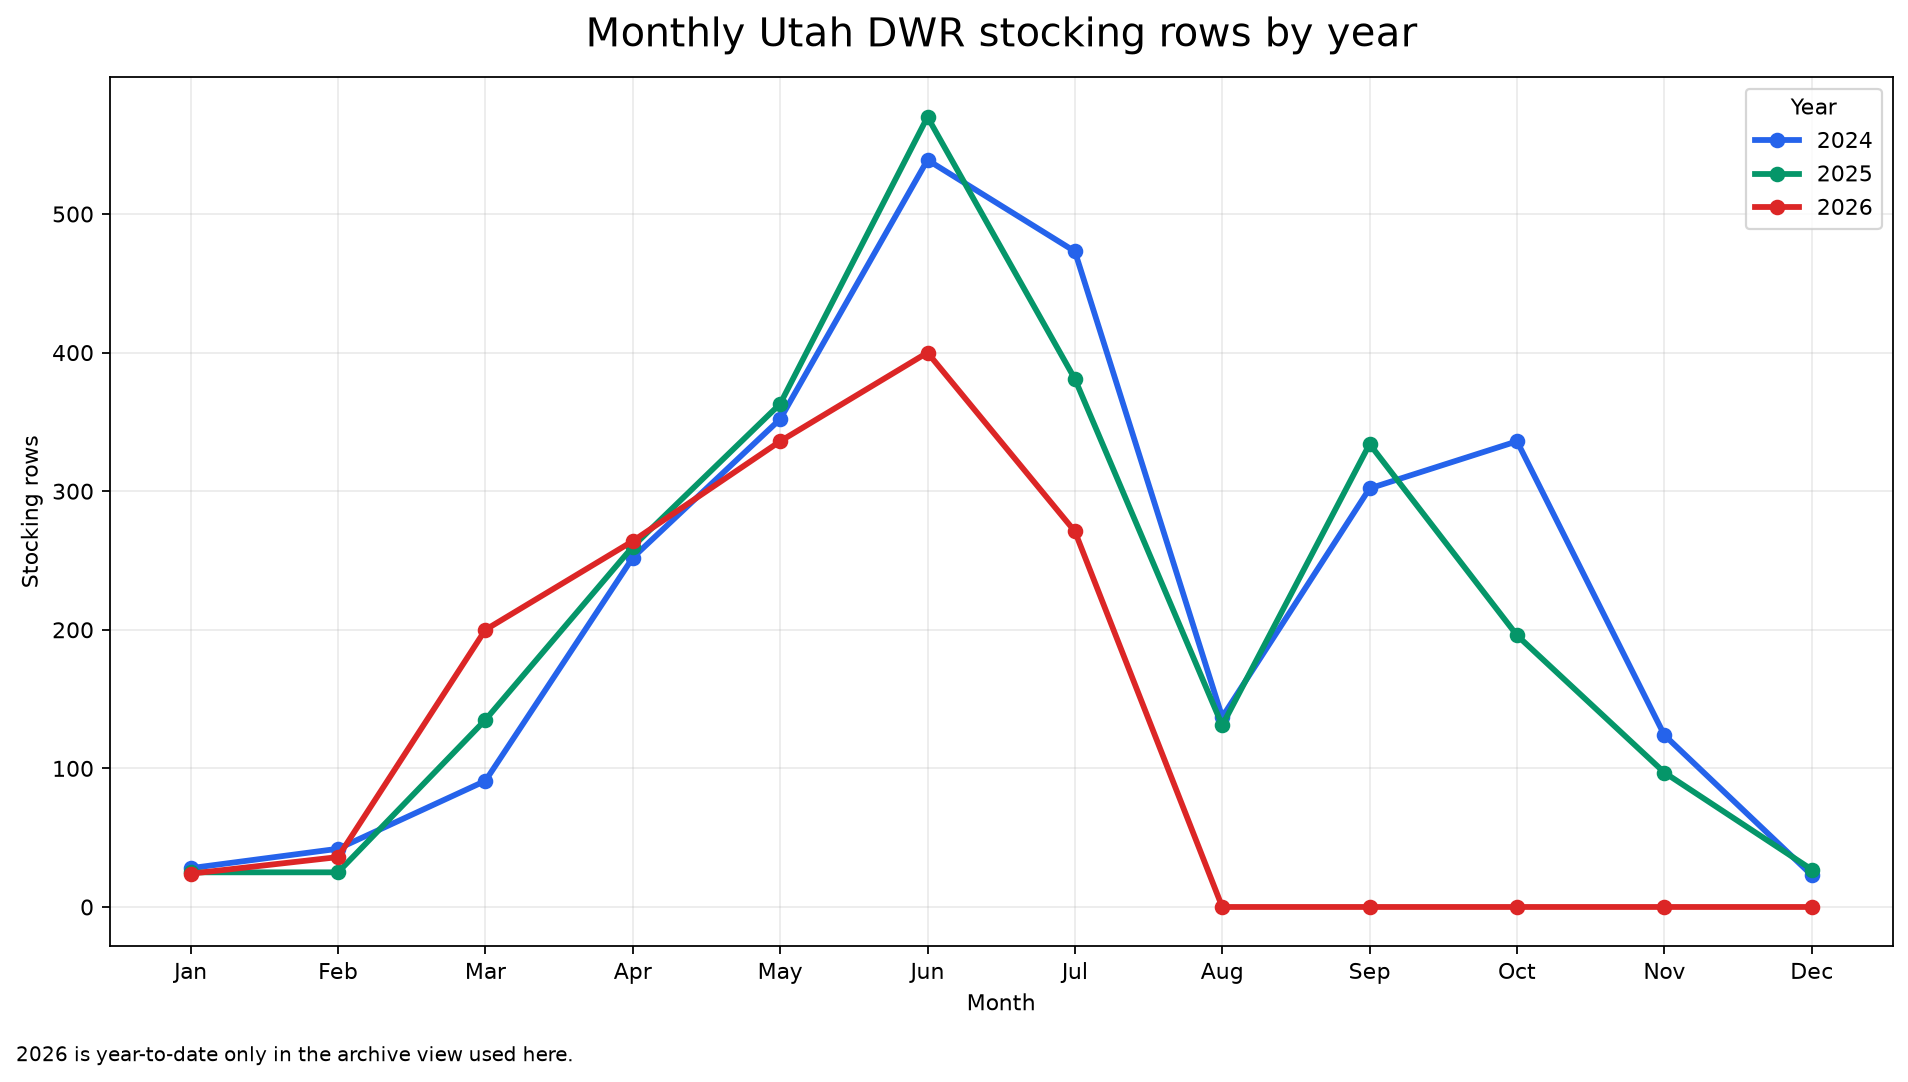
Across the full year pattern, a few things stand out:
- 2024 June: 539 rows
- 2025 June: 570 rows
- 2026 June: 400 rows
That says the archive currently shows June 2025 running stronger than June 2024 on row count, while June 2026 trails both. In other words, if you're asking whether stocking frequency changed, the answer is yes — but not in a straight line, and not in the same way every year.
Tibble Fork: the “7 times vs 3 times” claim depends on how you count
Tibble Fork is a great example of why this topic gets muddy fast.
The archive logs Tibble as TIBBLE FK RES. Through June 11 of each year, here is what the table shows:
- 2024: 7 rows across 4 stocking dates
- 2025: 4 rows across 4 stocking dates
- 2026: 9 rows across 5 stocking dates
That means two people can look at the same source and talk past each other:
- one person counts rows
- another counts distinct stocking dates
- another remembers only June dates, not the whole spring buildup
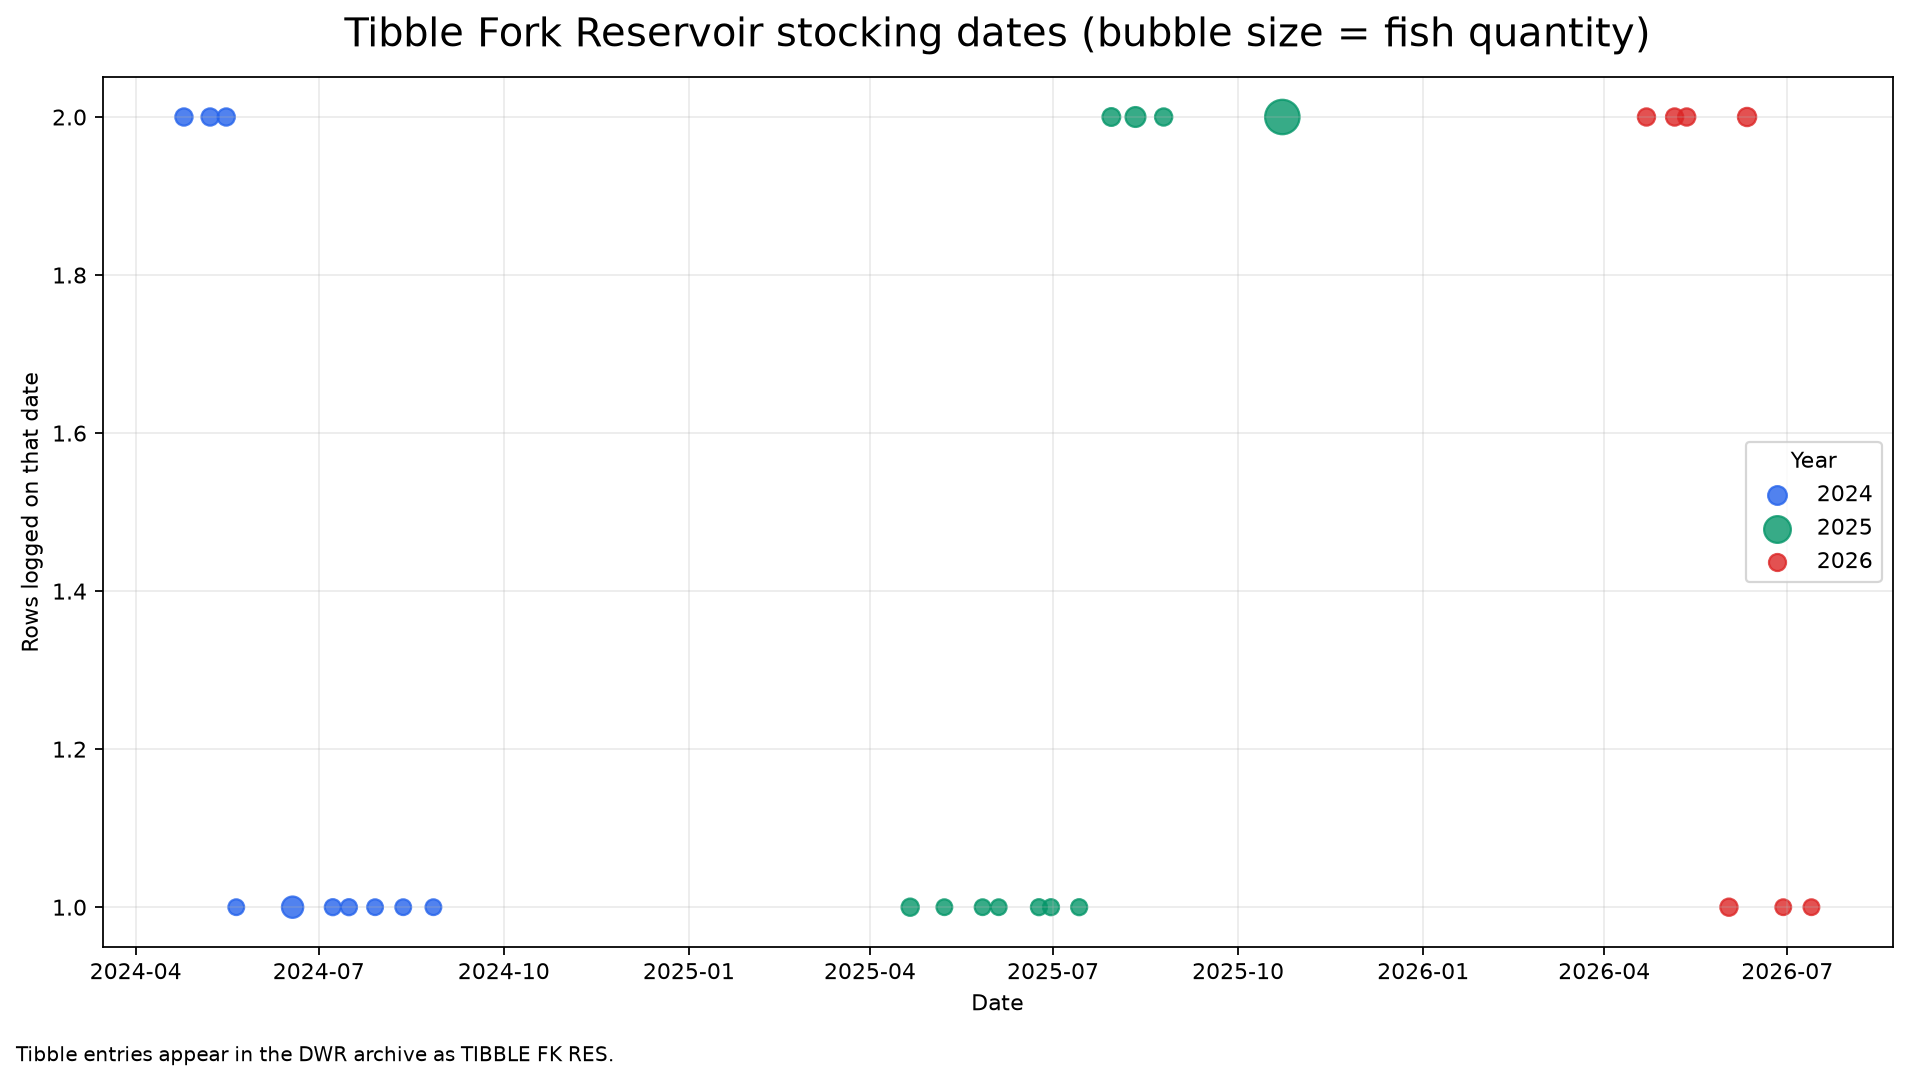
If you count distinct dates through June 11, Tibble Fork was 4 dates in 2024, 4 dates in 2025, and 5 dates in 2026. If you count rows, you get a different answer because the archive sometimes shows multiple lines on the same day.
So why did the original claim feel believable?
Three reasons:
- Rows are not the same as fish totals. You can log more rows while moving fewer fish.
- Rows are not the same as stocking trips. Same-day duplicate entries can inflate what feels like “frequency.”
- Species and water type matter. A year with fewer urban catfish rows and more trout-oriented entries can feel slower to a local pond angler even if the archive stays busy statewide.
There is also a timing caveat: public agency archives can be corrected or backfilled after people first notice a pattern. This article reflects what the public DWR pages showed when we checked them on July 23, 2026.
What anglers should actually use this for
If you're planning a Utah trip around recent stocking, the safest move is:
- Check the official DWR stocking archive for the current year.
- Read the quantity and average length columns, not only the number of rows.
- Compare your target water against a few nearby backups.
- Re-check the Utah fishing guidebook and any access or emergency updates before you leave.
Useful starting points:
- Utah fish stocking report
- Quick reports
- Where to fish
- How to catch recently stocked rainbow trout from shore
Sources
- Official Utah DWR fish stocking archive: https://dwrapps.utah.gov/fishstocking/Fish
- 2024 archive view: https://dwrapps.utah.gov/fishstocking/Fish?y=2024
- 2025 archive view: https://dwrapps.utah.gov/fishstocking/Fish?y=2025
- 2026 archive view: https://dwrapps.utah.gov/fishstocking/Fish?y=2026
- Utah Fishing page: https://wildlife.utah.gov/fishing
Utah Stocked Fish is independent and not affiliated with Utah DWR. Always verify current regulations, access, and stocking context before fishing.
Get free email updates
Get Utah stocking updates, trip-planning links and gear notes by email. Email signup is separate from paid SMS/voice plans, app subscriptions and the Fishing Playbook PDF.
Unsubscribe from email updates at any time. Read our website privacy policy.
Related Articles
 Illustration
Fish Lake September Stocking: 30,007 Cutbow Recorded
Fish Lake received 30,007 cutbow across four Utah DWR stocking entries dated September 3, 2026. The listed average lengths range from 6.04 to 6.27 inches. These records document fish released at Fish Lake in Sevier County; they do not establish current catch rates, fish locations or access conditions.
 Illustration
Utah’s Best Stocking Tool: How to Use the DWR Database to Find Recently-Stocked Fish Near You
Utah DWR calls its fish stocking database a “hidden gem.” Here’s how to use it to find recently-stocked trout and other fish near you — by date, county, species, and water.
 Illustration
How to Use Utah’s Fish Stocking Database (DWR): Find Recently Stocked Waters Near You
Utah’s DWR fish stocking database is the fastest way to find recently stocked trout (and other species) near you. Here’s how to use it, what the fields mean, and how to sanity-check your plan.
More Utah Fishing Updates
Browse more regulation changes, local reports, and seasonal how-to guides.
Back to all articles